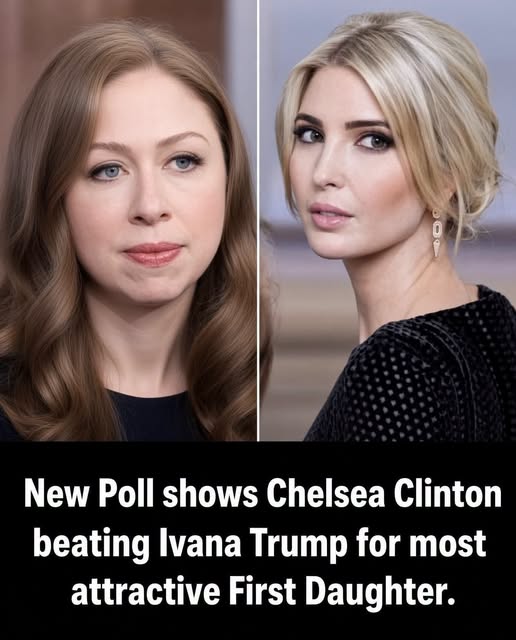
Do You Believe This Poll? Here’s What the Numbers Can—and Cannot—Tell You
A poll can look convincing when a headline presents a dramatic number, a large lead, or a surprising shift in public opinion. But before accepting it as proof that “America thinks” a certain way, it is worth examining how the survey was conducted.
The first question is simple: Who conducted the poll?
Reputable polling organizations usually publish information about their methodology. That information should identify the organization, field dates, number of respondents, population measured, and how respondents were selected. Reuters, for example, has explained that its Ipsos surveys use address-based sampling and weighting procedures designed to represent the U.S. population. Its methodology also distinguishes between larger and smaller surveys, which can have different margins of error.
If a poll circulating on social media does not identify who conducted it, when it was conducted, or how respondents were selected, that is an important reason to be cautious.
The second question is: Who was actually surveyed?
A poll of U.S. adults is not the same thing as a poll of registered voters, and neither is necessarily the same as a poll of likely voters. Those groups can produce different results because people who are eligible to vote, registered to vote, and expected to participate in an election are not identical populations.
The wording also matters. Responses can change depending on phrasing, preceding information, and answer choices. Reputable polling organizations normally publish the exact questions so readers can evaluate the wording for themselves.
Then there is the sample size.
Some assume a poll is unreliable because it surveyed only around 1,000 people in a country with hundreds of millions of residents. A properly selected sample can provide useful information about a much larger population. What matters is how respondents were selected and whether the final sample represents the population.
The margin of error is another number worth understanding.
A typical survey of about 1,000 people may have a sampling margin of error of roughly plus or minus three percentage points, although the exact figure depends on the survey design and weighting. That means sampling variation alone can move an estimate several points in either direction. It does not mean the poll is guaranteed to be within three points of reality.
A margin of error does not capture every source of polling error. Pew Research Center has noted that noncoverage, nonresponse, and measurement problems can also affect survey results. A person who refuses to participate may differ systematically from someone who answers, and a question may fail to measure public opinion accurately even when the sample itself is carefully constructed.
That is why a poll showing Candidate A at 51 percent and Candidate B at 48 percent should not automatically be treated as evidence that the race is decisively settled. The numbers describe the responses collected during a particular period. They do not guarantee what voters will think later, and they do not by themselves predict what will happen on Election Day.
Timing matters, too.
Public opinion can change after debates, major news events, economic developments, scandals, policy announcements, court decisions, international events, or other developments. A poll conducted several weeks ago may accurately describe what respondents said at that time while no longer representing current opinion.
This matters during an election season. Recent polling can provide a snapshot, but even current polling should be interpreted in context. The Washington Post reported in September 2026 that polling experts continue to emphasize sample size, methodology, and margin of error when evaluating election surveys. The article also noted that campaign-sponsored polls can present additional reasons for caution.
Another useful test is comparing multiple polls instead of relying on one. Looking at several independent surveys can reveal whether a reported movement is appearing consistently or whether one poll stands apart from the broader evidence. That comparison can provide useful context.
One poll can contain unusual results because of its sample, methodology, timing, or ordinary statistical variation. No single poll should carry more weight than the quality of its sampling, questions, timing, and transparency. Poll averages can be useful for identifying general patterns, although averages also depend on which polls are included and how they are weighted.
It is also important to distinguish between a scientific survey and an online “poll” posted for public participation.
A social-media poll that allows anyone to click an answer is measuring the opinions of the people who chose to participate. It is not automatically representative of the broader population. Someone who sees the post, has strong feelings about the subject, and decides to vote may be much more likely to participate than someone who does not encounter the post or has little interest in the issue.
So, do you believe the poll?
The most accurate answer is: believe it cautiously, and check the methodology before drawing conclusions.
A credible poll is not necessarily “true” simply because it comes from a respected organization. At the same time, an unfamiliar poll is not automatically false. The strongest approach is to examine the evidence behind the number: who conducted it, who was surveyed, how many people participated, how respondents were selected, what questions were asked, when the survey took place, what the margin of error was, and whether other reputable polls show similar results.
Most importantly, a poll is a measurement of opinion at a particular moment, not a command telling anyone what to believe or how to vote. It can help people understand public sentiment, but it cannot replace independent judgment.
If the poll you are looking at has a surprising result, the best next step is not simply to accept it or dismiss it because you like or dislike the number. Find the original survey, read its methodology, check the field dates, and compare it with other credible surveys.
That extra minute of checking can make a major difference. A dramatic percentage may grab attention, but the details behind that percentage are what determine how much confidence readers should place in it.